Tap image to enlarge이미지를 누르면 크게 볼 수 있습니다
Application & Purpose작품의 목적
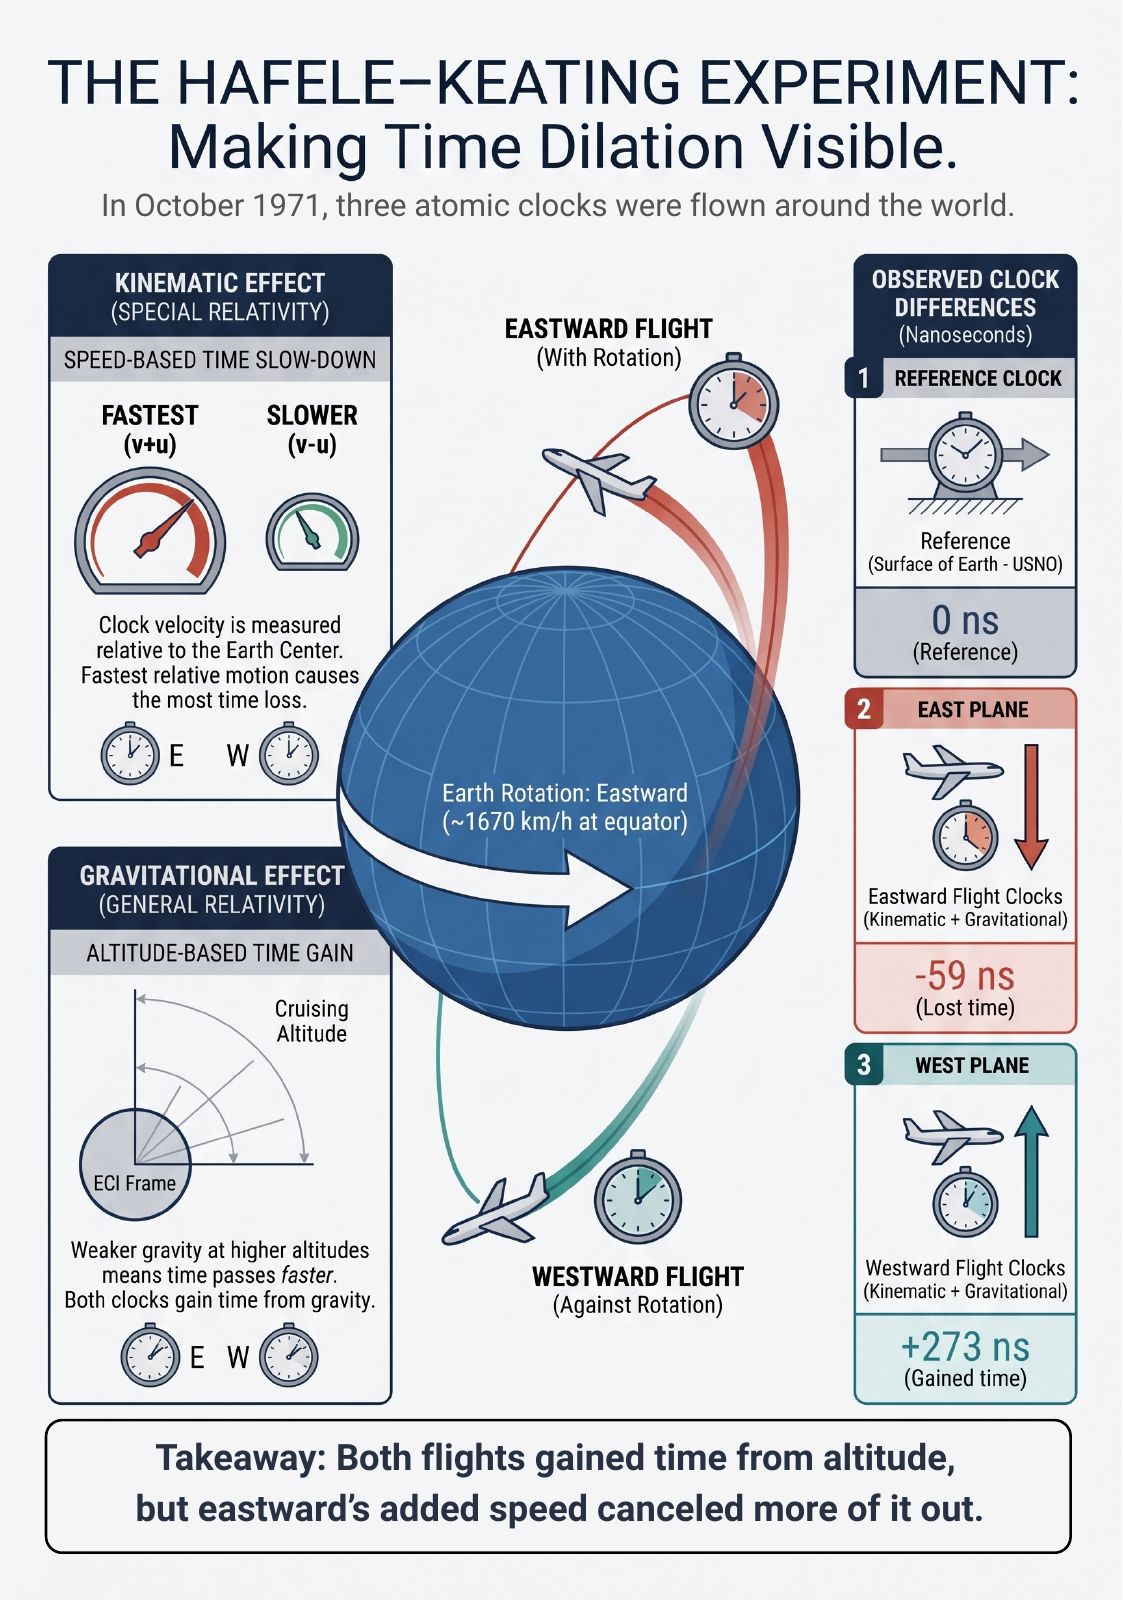
The Hafele–Keating experiment (1971) proved Einstein's theory of relativity by using commercial airliners and atomic clocks. This infographic illustrates how two competing relativistic effects (speed-based time loss, gravity-based time gain) combine differently depending on the direction of flight, thereby making an invisible physical phenomenon understandable to a general audience.
하펠레–키팅 실험(1971)은 민항기와 원자시계로 아인슈타인의 상대성이론을 증명했습니다. 이 인포그래픽은 서로 경쟁하는 두 상대론적 효과(속도에 의한 시간 손실, 중력에 의한 시간 이득)가 비행 방향에 따라 어떻게 다르게 결합하는지 보여주어, 보이지 않는 물리 현상을 일반 관객이 이해할 수 있게 합니다.
AI Tools & WorkflowAI 도구와 작업 흐름
I used Gemini Pro 3.1 to iteratively design the infographic's layout and components. After establishing the core composition and visual metaphors, I exported the image to Canva for final manual typography edits and cropping.
Gemini Pro 3.1로 인포그래픽의 레이아웃과 구성 요소를 반복 설계했습니다. 핵심 구성과 시각적 은유를 정한 뒤 이미지를 Canva로 내보내 타이포그래피를 직접 수정하고 잘라냈습니다.
Process & Iterations제작 과정과 반복
The design process required prioritizing audience accessibility over academic formality. Since AI image models default toward maximalist output such as dense imagery and excessive embedded text, explicitly prompting for a "minimalist" aesthetic produced cleaner results. In subsequent iterations, I prompted the AI to replace dense physics notation with intuitive metaphors, such as speedometers, and to limit text to one sentence per panel. I also had to explicitly correct the AI's logical mapping by enforcing strict color-coding rules (e.g., matching the red flight path exactly with its red result card) to prevent visual contradictions. Finally, after removing redundant boxes and typographical artifacts, I moved to Canva to trim and optimize the image for exhibition viewing.
디자인 과정에서는 학술적 격식보다 관객의 접근성을 우선해야 했습니다. AI 이미지 모델은 기본적으로 조밀한 이미지와 과도한 삽입 텍스트 같은 맥시멀한 결과를 내놓기 때문에, '미니멀' 미학을 명시적으로 요청하자 더 깔끔한 결과가 나왔습니다. 이후 반복에서는 조밀한 물리 표기를 속도계 같은 직관적 은유로 바꾸고 패널당 한 문장으로 텍스트를 제한하도록 요청했습니다. 또 시각적 모순을 막기 위해 엄격한 색 규칙(예: 빨간 비행 경로와 빨간 결과 카드를 정확히 일치)을 강제해 AI의 논리적 대응을 직접 바로잡아야 했습니다. 마지막으로 불필요한 상자와 글자 오류를 제거한 뒤 Canva에서 전시 관람에 맞게 다듬었습니다.
A Researcher's Perspective연구자의 관점
As a researcher with a background in media arts, I value how visual communication democratizes complex science. In that sense, the real challenge lied in removing cognitive friction. By stripping away academic jargon and aligning visual cues logically, this process reinforced that effective science outreach is fundamentally an exercise in user experience design. The AI served as a rapid prototyping tool, which let me test and refine communicative metaphors efficiently.
미디어아트 배경을 가진 연구자로서, 시각 소통이 복잡한 과학을 대중화하는 방식을 소중히 여깁니다. 그런 의미에서 진짜 과제는 인지적 마찰을 제거하는 데 있었습니다. 학술 용어를 걷어내고 시각적 단서를 논리적으로 정렬하는 과정을 거치며, 효과적인 과학 아웃리치는 근본적으로 사용자 경험 디자인의 연습이라는 점을 다시 확인했습니다. AI는 소통의 은유를 효율적으로 시험하고 다듬게 해 준 빠른 프로토타이핑 도구였습니다.