Tap image to enlarge이미지를 누르면 크게 볼 수 있습니다
Application & Purpose작품의 목적
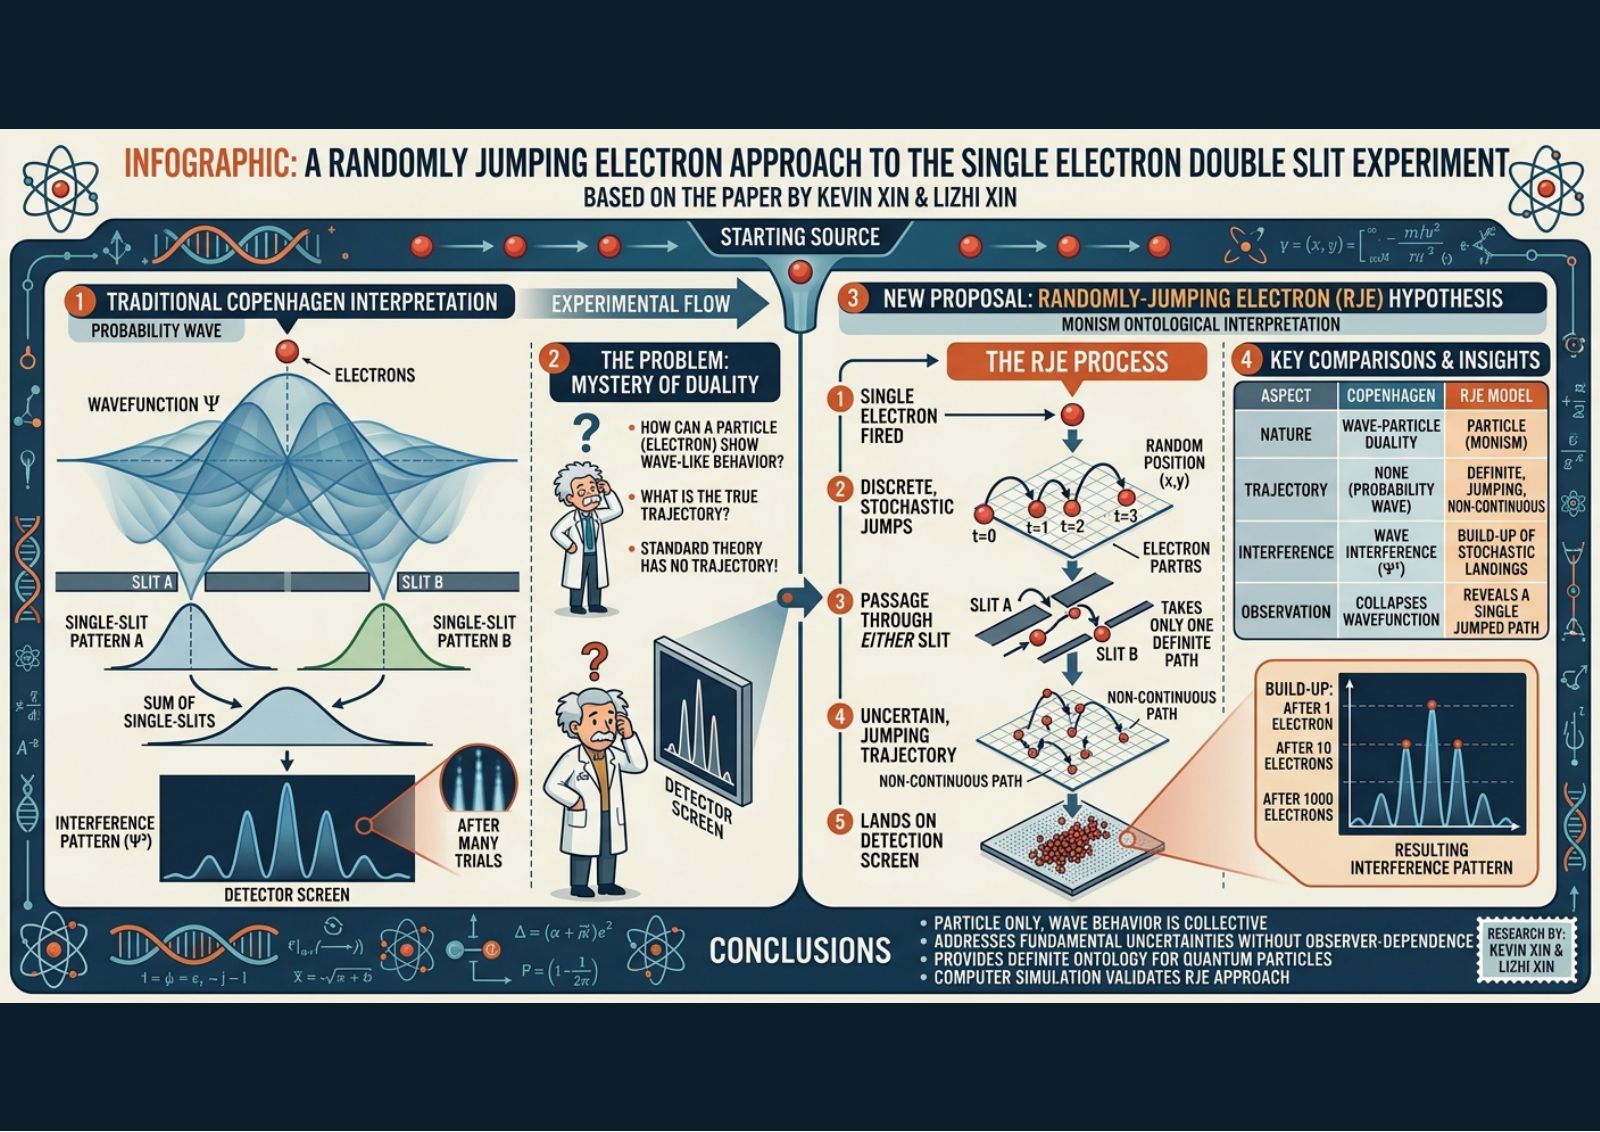
This infographic presents the Randomly-Jumping Electron (RJE) Hypothesis as a Monism Ontological solution to quantum duality in the double-slit experiment. By comparing classical Copenhagen wavefunction collapse against discrete, stochastic particle trajectories, it demonstrates how individual particle landings build up interference patterns, offering an intuitive, contradiction-free educational tool for theoretical physics research.
이 인포그래픽은 이중 슬릿 실험의 양자 이중성에 대한 일원론적 존재론의 해법으로 무작위 도약 전자(RJE) 가설을 제시합니다. 고전적 코펜하겐 파동함수 붕괴와 이산적·확률적 입자 궤적을 비교하여, 개별 입자의 착지가 어떻게 간섭 무늬를 쌓아 올리는지 보여주고, 이론물리학 연구를 위한 직관적이고 모순 없는 교육 도구를 제공합니다.
AI Tools & WorkflowAI 도구와 작업 흐름
AI tools generated data visualization charts and computational step-by-step process diagrams. Generative layout models then assembled the four-quadrant infographic structure, integrating flow arrows, comparison tables, cartoon characters, and technical schematics into a scannable scientific poster.
AI 도구로 데이터 시각화 차트와 계산 단계별 과정 도식을 생성했습니다. 이어 생성형 레이아웃 모델이 흐름 화살표, 비교 표, 만화 캐릭터, 기술 도식을 통합해 훑어보기 쉬운 과학 포스터의 4분면 인포그래픽 구조를 조립했습니다.
Process & Iterations제작 과정과 반복
Our iterative process systematically bridged complex physics concepts with clean infographic design: Information Hierarchy: We structured the canvas into four distinct numbered sections: contrasting the Copenhagen Interpretation (1) and Duality Problem (2) on the left against the RJE Process (3) and Comparison Table/Build-up Graph (4) on the right. Visual Flow: We refined directional elements—adding experimental flow arrows and sequential step callouts (1–5)—to guide viewers seamlessly from particle launch to detection. Detail Tuning: Multiple iterations were conducted to align comparative metrics in the table, clean up mathematical notation along the borders, polish character expressions, and ensure the build-up graph clearly illustrated cumulative particle distribution over time.
복잡한 물리 개념과 깔끔한 인포그래픽 디자인을 체계적으로 잇는 반복 과정이었습니다. 정보 위계: 캔버스를 번호가 붙은 네 구역으로 구성해, 왼쪽의 코펜하겐 해석(1)과 이중성 문제(2)를 오른쪽의 RJE 과정(3)과 비교 표/누적 그래프(4)와 대비시켰습니다. 시각 흐름: 실험 흐름 화살표와 순차 단계 표시(1–5)를 추가해 관람자가 입자 발사에서 검출까지 매끄럽게 따라가도록 방향 요소를 다듬었습니다. 세부 조정: 표의 비교 지표를 정렬하고, 테두리의 수학 표기를 정리하고, 캐릭터 표정을 다듬고, 누적 그래프가 시간에 따른 입자 분포를 명확히 보여주도록 여러 차례 반복했습니다.
A Researcher's Perspective연구자의 관점
Using AI to visualize the RJE Hypothesis streamlined complex diagramming, instantly turning mathematical concepts into clear step-by-step schematics and comparison tables. However, maintaining exact typographic precision across dense technical elements—like mathematical symbols, axis labels, and tabular alignment—remained challenging and required constant iteration. For fellow researchers, AI is an extraordinary accelerator for infographic layout, provided you maintain strict quality control over scientific terminology and visual logic.
AI로 RJE 가설을 시각화하자 복잡한 도식 작업이 간소해져, 수학 개념이 즉시 명확한 단계별 도식과 비교 표로 바뀌었습니다. 하지만 수학 기호, 축 라벨, 표 정렬처럼 조밀한 기술 요소 전반에서 정확한 타이포그래피를 유지하는 일은 여전히 어려워 끊임없는 반복이 필요했습니다. 동료 연구자들에게: 과학 용어와 시각 논리에 대한 엄격한 품질 관리를 유지한다면 AI는 인포그래픽 레이아웃의 놀라운 가속기입니다.