Tap image to enlarge이미지를 누르면 크게 볼 수 있습니다
Application & Purpose작품의 목적
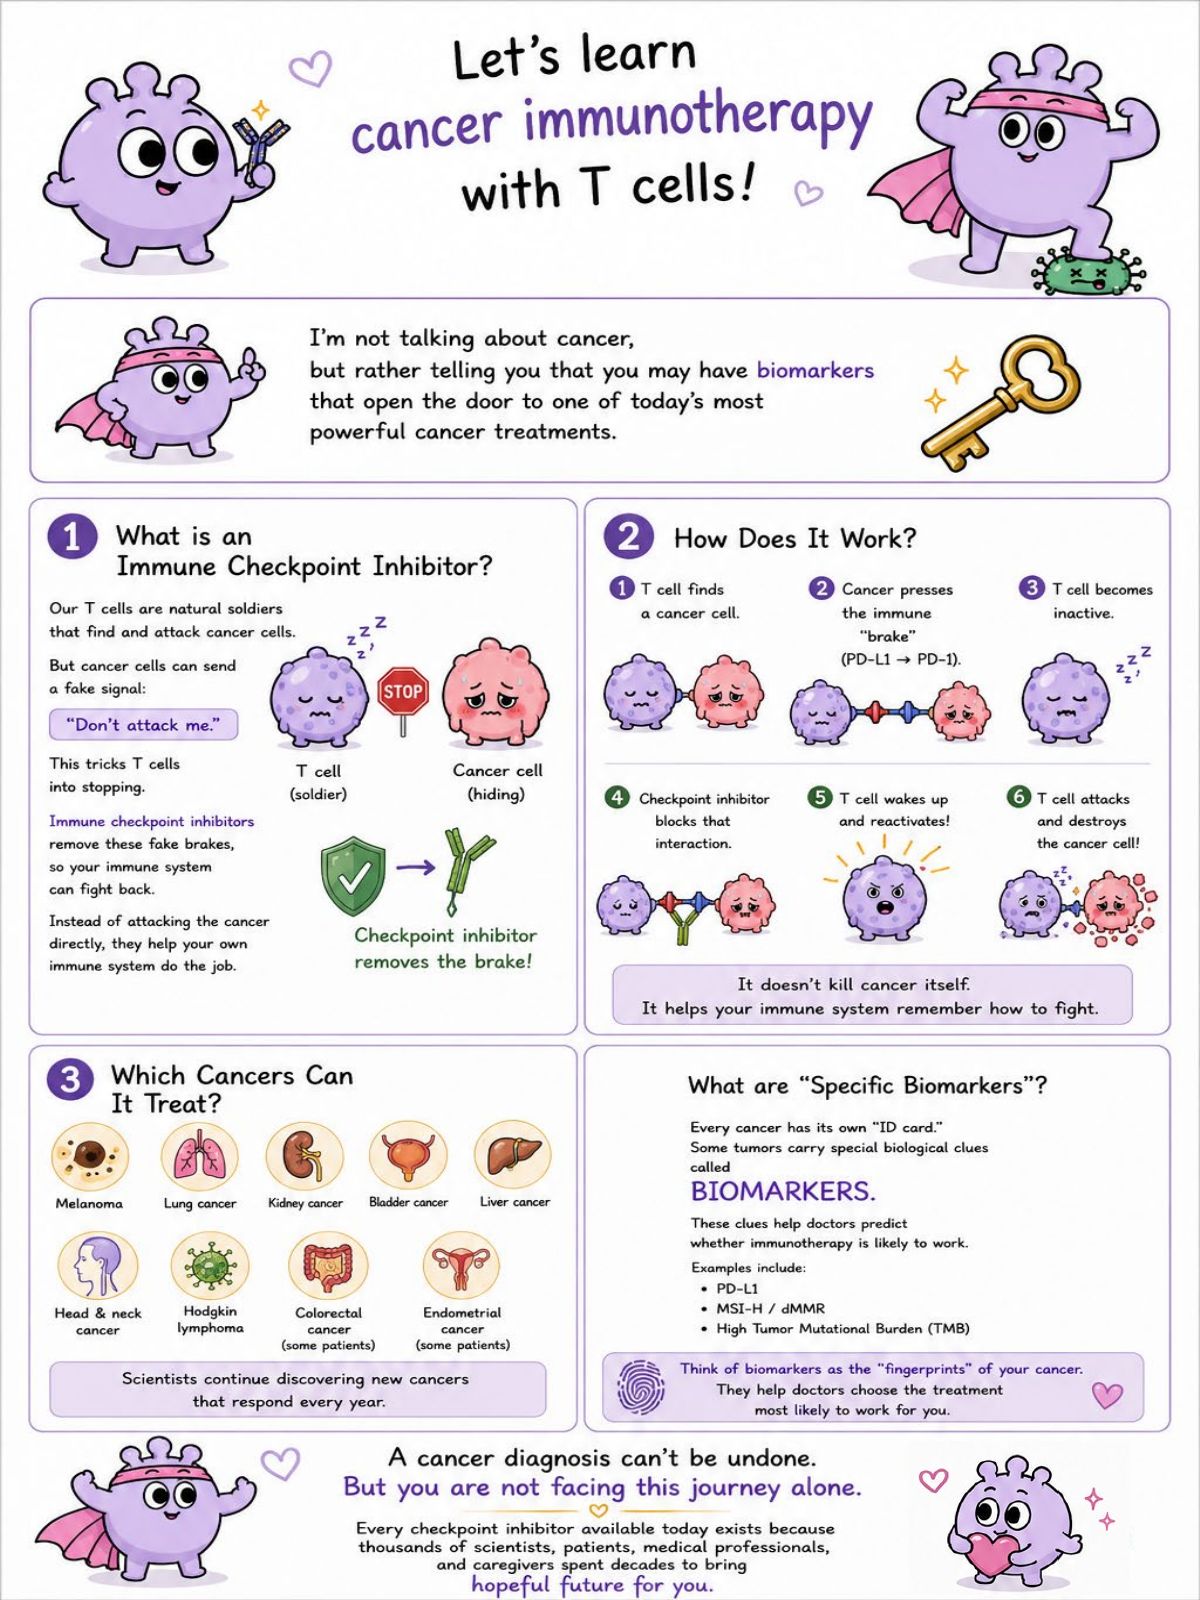
Immunotherapy, which is a type of chemotherapy that activates immune checkpoint inhibitors, is a relatively new line of cancer chemotherapy. Since this therapy was approved in 2017, patients and their caregivers are unfamiliar with this chemotherapy. Thus, the purpose of this infographic is to easily explain its process and how T cells fight cancer cells for newly diagnosed patients.
면역관문억제제를 활성화하는 화학요법의 한 종류인 면역치료는 비교적 새로운 암 치료법입니다. 2017년에 승인된 이후로 환자와 보호자에게는 아직 낯선 치료입니다. 그래서 이 인포그래픽은 새로 진단받은 환자에게 치료 과정과 T세포가 암세포와 싸우는 방식을 쉽게 설명하는 것이 목적입니다.
AI Tools & WorkflowAI 도구와 작업 흐름
I used ChatGPT to generate this infographic. I first searched Google for a single T cell illustration I liked, then built a core layout in PPT. With that reference image and several ChatGPT iterations, I finalized this infographic in PPT to manually resize it to A3.
ChatGPT로 이 인포그래픽을 만들었습니다. 먼저 구글에서 마음에 드는 T세포 일러스트 하나를 찾고 PPT에서 기본 레이아웃을 잡았습니다. 그 참조 이미지와 여러 차례의 ChatGPT 반복을 거쳐 PPT에서 인포그래픽을 완성하고 A3 크기로 직접 조정했습니다.
Process & Iterations제작 과정과 반복
Since this inforgraphic targets patients, information accuracy was the top priority. I ordered ChatGPT to use “Immune Checkpoint Inhibitors” content from the US National Cancer Institute. I chose friendly and accessible cell image, then built a brief box layout in PPT with that image placed in the desired section. Next, I ordered ChatGPT to generate an infographic containing 1) What is immune checkpoint inhibitor, 2) How does it work, 3) What cancer it treats, 4) Easy explanation of biomarkers. I also specified the title and the following message. In the end, I added words of empowerment that patients and their caregivers would find encouraging, as patients often feel daunted at their diagnosis. Finally, I requested the design feel approachable.
이 인포그래픽은 환자를 대상으로 하므로 정보의 정확성이 최우선이었습니다. ChatGPT에 미국 국립암연구소(NCI)의 '면역관문억제제' 내용을 사용하도록 지시했습니다. 친근하고 접근하기 쉬운 세포 이미지를 고른 뒤 PPT에서 간단한 박스 레이아웃을 만들고 원하는 위치에 이미지를 배치했습니다. 그다음 ChatGPT에 1) 면역관문억제제란 무엇인가, 2) 어떻게 작동하는가, 3) 어떤 암을 치료하는가, 4) 바이오마커의 쉬운 설명을 담은 인포그래픽을 생성하도록 지시했습니다. 제목과 이어지는 메시지도 지정했습니다. 마지막에는 진단에 압도되기 쉬운 환자와 보호자가 힘을 얻을 수 있는 격려의 말을 넣었습니다. 끝으로 디자인이 친근하게 느껴지도록 요청했습니다.
A Researcher's Perspective연구자의 관점
As a PhD candidate researching cancer and a former nurse, I've seen many cancer patients and caregivers struggle to understand the treatment process, as healthcare professionals couldn't provide adequate information in short-staffed environment. I’ve always wondered how to quickly explain treatment options, side effects, and clinical outcomes. Generating this infographic was thus meaningful since it showed me how AI could help us by giving more bandwidth to healthcare professionals while effectively educating patients with accurate knowledge.
암을 연구하는 박사과정생이자 전직 간호사로서, 인력이 부족한 환경에서 의료진이 충분한 정보를 제공하지 못해 많은 암 환자와 보호자가 치료 과정을 이해하는 데 어려움을 겪는 것을 보아 왔습니다. 치료 선택지, 부작용, 임상 결과를 어떻게 빠르게 설명할 수 있을지 늘 고민했습니다. 이 인포그래픽을 만드는 일은 AI가 의료진에게 더 많은 여유를 주면서 환자를 정확한 지식으로 효과적으로 교육하는 데 어떻게 도움이 될 수 있는지 보여주었기에 의미가 있었습니다.