Tap image to enlarge이미지를 누르면 크게 볼 수 있습니다
Application & Purpose작품의 목적
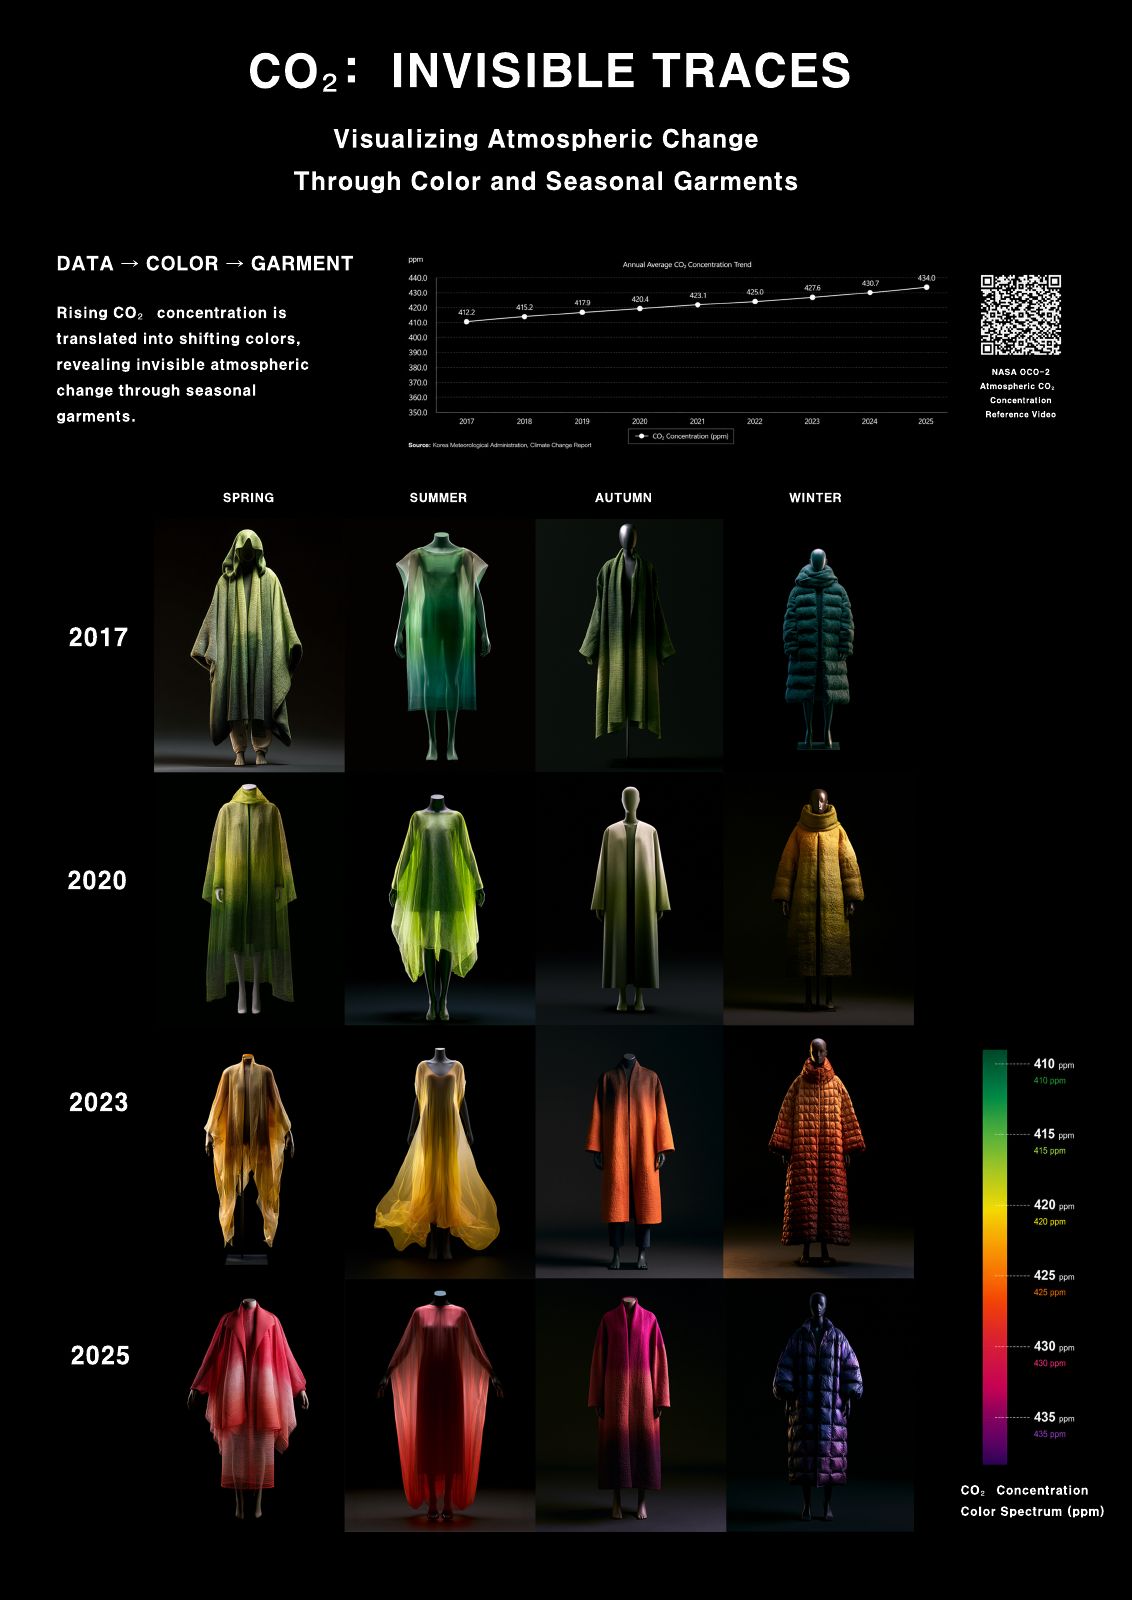
CO₂: INVISIBLE TRACES translates rising atmospheric CO₂ concentration into colour across seasonal garments. By transforming numerical data into AI-generated fashion imagery, the project makes an invisible environmental trend visually perceptible and comparable across years. It explores fashion as an intuitive visual language for communicating scientific data beyond conventional graphs and numerical values.
〈CO₂: 보이지 않는 흔적〉은 상승하는 대기 중 CO₂ 농도를 계절 의상의 색으로 번역합니다. 수치 데이터를 AI 생성 패션 이미지로 변환해, 보이지 않는 환경 추세를 시각적으로 지각하고 연도별로 비교할 수 있게 합니다. 기존의 그래프와 수치를 넘어 과학 데이터를 전달하는 직관적 시각 언어로서의 패션을 탐구합니다.
AI Tools & WorkflowAI 도구와 작업 흐름
ChatGPT was used to interpret CO₂ data and develop the visual mapping system. Midjourney generated seasonal fashion imagery through iterative prompting, refining colour, silhouette, material, and layering while maintaining consistency across years and seasons.
ChatGPT로 CO₂ 데이터를 해석하고 시각 매핑 체계를 개발했습니다. Midjourney로 반복 프롬프팅을 통해 계절 패션 이미지를 생성하며, 연도와 계절에 걸쳐 일관성을 유지하면서 색, 실루엣, 소재, 레이어링을 다듬었습니다.
Process & Iterations제작 과정과 반복
I began by translating atmospheric CO₂ concentration data into a colour-based visual system for fashion. Through repeated AI image generation, I explored silhouettes, materials, transparency, and layering across four seasonal garment types. Early iterations varied widely, allowing me to examine how consistently the same visual framework could communicate changes in CO₂ levels. I gradually reduced unnecessary stylistic variation and strengthened the relationship between data and appearance. Rising CO₂ concentration was mapped to a progressive colour spectrum, moving from green toward yellow, orange, red, and purple. The final images were selected and organized by year and season, allowing viewers to compare changes over time while maintaining a recognizable seasonal structure.
대기 중 CO₂ 농도 데이터를 패션을 위한 색 기반 시각 체계로 옮기는 데서 시작했습니다. 반복적인 AI 이미지 생성으로 네 가지 계절 의상 유형에 걸쳐 실루엣, 소재, 투명도, 레이어링을 탐색했습니다. 초기 결과는 편차가 커서, 같은 시각 틀이 CO₂ 수준 변화를 얼마나 일관되게 전달하는지 살펴볼 수 있었습니다. 점차 불필요한 스타일 변주를 줄이고 데이터와 외관의 관계를 강화했습니다. 상승하는 CO₂ 농도는 초록에서 노랑, 주황, 빨강, 보라로 이어지는 점진적 색 스펙트럼에 대응시켰습니다. 최종 이미지는 연도와 계절별로 선별·배치해, 알아볼 수 있는 계절 구조를 유지하면서 시간에 따른 변화를 비교할 수 있게 했습니다.
A Researcher's Perspective연구자의 관점
I approach AI image-making as an experimental research process rather than a tool for producing finished images. AI enables rapid visual testing of how data can be translated into colour, material, and form. Through repeated generation, comparison, and selection, I examine both the possibilities and limitations of AI interpretation. In this project, AI functions as a visual research partner, helping transform invisible environmental data into forms that can be intuitively perceived and compared.
저는 AI 이미지 제작을 완성된 이미지를 만드는 도구가 아니라 실험적 연구 과정으로 접근합니다. AI는 데이터가 색, 소재, 형태로 어떻게 번역될 수 있는지 빠르게 시각적으로 시험하게 해 줍니다. 반복적인 생성, 비교, 선택을 통해 AI 해석의 가능성과 한계를 함께 살핍니다. 이 프로젝트에서 AI는 보이지 않는 환경 데이터를 직관적으로 지각하고 비교할 수 있는 형태로 바꾸는 시각 연구 파트너로 기능합니다.